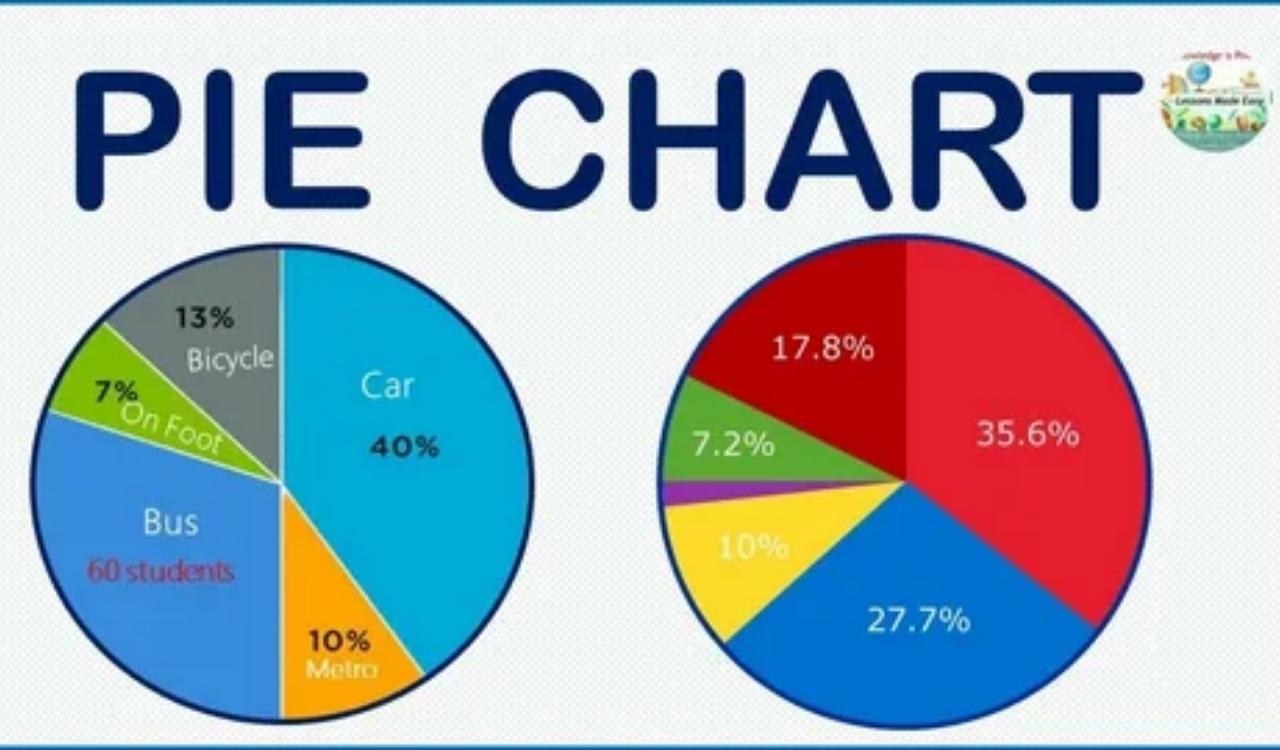
Learning how to calculate pie chart percentages is an important skill when working with data. A pie chart uses percentages to show how each category contributes to the whole, making information easier to understand at a glance. Whether you’re creating a school project, analyzing survey results, or preparing a business report, knowing the pie chart percentage formula helps you represent data accurately.
In this guide, you’ll learn how to calculate pie chart percentages step by step, convert percentages to degrees, and solve real-world pie chart examples with confidence.
What Is a Pie Chart?
A pie chart, also called a pie graph or circle chart, is a visual tool used to display data as parts of a whole. The entire circle represents 100%, while each slice shows the percentage share of a specific category. Pie charts are commonly used in data visualization because they make comparisons easy to understand.
Why Pie Charts Use Percentages
Pie charts use percentages because they clearly show how much each category contributes to the total. Instead of analyzing large numbers, readers can quickly understand the percentage distribution and compare categories more effectively.
When Pie Charts Are the Best Choice for Data Visualization
Pie charts work best when showing parts of a whole. They are commonly used for survey results, sales breakdowns, budget allocation, website traffic sources, and market share analysis.
Understanding the Relationship Between Values, Percentages, and Angles
Before learning how to calculate percentage in a pie chart, it’s important to understand how values, percentages, and angles are connected.
Raw Data Values
Raw data values are the original numbers collected from a dataset. These values form the foundation of every pie chart calculation.
Percentage Shares
Percentage shares show the proportion of each category compared to the total dataset. They help readers understand the relative importance of each category.
Pie Chart Angles
Pie chart angles determine the size of each slice. Since a complete circle contains 360 degrees, each percentage can be converted into a corresponding angle.
Formula for Calculating Pie Chart Percentages
To calculate pie chart percentages, use the following formula:
Percentage = (Category Value ÷ Total Value) × 100
This formula converts raw data into percentages that can be displayed visually in a pie chart.
Why All Percentages Must Equal 100%
Because a pie chart represents the entire dataset, the sum of all percentages should always equal 100%.
How to Calculate Pie Chart Percentages Step by Step
Follow these simple steps:
Step 1: List All Data Values
Write down all category values.
Step 2: Calculate the Total
Add all values together to find the total dataset.
Step 3: Divide Each Value by the Total
Divide the category value by the total value.
Step 4: Multiply by 100
Convert the result into a percentage.
Step 5: Verify the Total
Ensure all percentages add up to 100%.
Example 1: Calculate Pie Chart Percentages From Raw Data
Suppose a survey contains the following data:
| Category | Value |
| A | 40 |
| B | 30 |
| C | 20 |
| D | 10 |
Total = 40 + 30 + 20 + 10 = 100
Calculations:
- A = 40%
- B = 30%
- C = 20%
- D = 10%
These percentages can now be used to create a pie chart.
How to Convert Percentages Into Pie Chart Angles
To create a pie chart manually, percentages must be converted into degrees.
Formula:
Angle = (Percentage ÷ 100) × 360
This formula ensures that each sector accurately represents its percentage share.
Example 2: Convert Pie Chart Percentages to Degrees
| Percentage | Angle |
| 10% | 36° |
| 20% | 72° |
| 25% | 90° |
| 50% | 180° |
| 75% | 270° |
For example:
40% × 360 ÷ 100 = 144°
Therefore, the slice representing 40% should cover 144 degrees.
How to Calculate Percentages From an Existing Pie Chart
Sometimes you may only know the angle of a pie chart sector. In this case, you can calculate the percentage represented by that slice.
Formula:
Percentage = (Sector Angle ÷ 360) × 100
This method is useful when analyzing existing charts or exam questions.
Example 3: Find Percentages From Pie Chart Angles
| Sector Angle | Percentage |
| 45° | 12.5% |
| 90° | 25% |
| 120° | 33.3% |
| 180° | 50% |
For example:
90° ÷ 360 × 100 = 25%
Therefore, a 90-degree sector represents 25% of the total data.
Pie Chart Percentage Calculator
A pie chart percentage calculator can simplify calculations and reduce errors. However, understanding the underlying formula is still important because it helps verify results and improves data interpretation skills.
Many online tools allow users to enter raw values and automatically generate percentages and pie chart sectors.
How to Calculate Pie Chart Percentages in Excel
Microsoft Excel makes percentage calculations easy.
Step 1
Enter your data values into a worksheet.
Step 2
Use the formula:
=Value/Total*100
Step 3
Apply the formula to all categories.
Step 4
Insert a pie chart using Excel’s chart tools.
Excel automatically calculates and displays percentages when configured correctly.
How to Calculate Pie Chart Percentages in Google Sheets
Google Sheets offers a similar process.
- Enter category data.
- Calculate percentages using formulas.
- Select the data range.
- Insert a pie chart.
- Enable percentage labels.
This approach provides a quick way to create professional charts.
Real-Life Examples of Pie Chart Percentages
Pie charts are used in many everyday situations.
Monthly Budget Allocation
Track spending on rent, food, utilities, and entertainment.
Sales Analysis
Measure product performance and revenue contribution.
Website Traffic Sources
Visualize traffic from search engines, social media, and referrals.
Survey Results
Display public opinions and customer feedback.
Common Mistakes When Calculating Pie Chart Percentages
Avoid these common errors:
Using the Wrong Total
Always calculate the correct total before finding percentages.
Forgetting to Multiply by 100
Without multiplying by 100, the result remains a decimal.
Incorrect Degree Conversion
Use 360 degrees as the basis for all calculations.
Rounding Errors
Excessive rounding can cause percentages to exceed or fall short of 100%.
Pie Chart Percentages vs Bar Charts
Both chart types have strengths.
When Pie Charts Are Better
- Showing parts of a whole
- Displaying percentage shares
- Visualizing category distribution
When Bar Charts Are Better
- Comparing many categories
- Showing small differences
- Tracking changes over time
Advantages of Using Percentages in Pie Charts
- Easy to understand
- Simplifies complex data
- Highlights category importance
- Improves visual communication
- Supports quick decision-making
Limitations of Pie Chart Percentages
- Difficult to read with many categories
- Small differences may be hard to identify
- Not ideal for trend analysis
- Less effective for detailed comparisons
Quick Reference Conversion Table
| Fraction | Percentage | Degrees |
| 1/10 | 10% | 36° |
| 1/5 | 20% | 72° |
| 1/4 | 25% | 90° |
| 1/3 | 33.3% | 120° |
| 1/2 | 50% | 180° |
| 3/4 | 75% | 270° |
Frequently Asked Questions
What is the formula for calculating pie chart percentages?
The formula is:
Percentage = (Category Value ÷ Total Value) × 100
How do you convert percentages into pie chart degrees?
Use:
Angle = (Percentage ÷ 100) × 360
Why do pie chart percentages add up to 100%?
Because the entire pie chart represents the complete dataset.
Can Excel calculate pie chart percentages automatically?
Yes. Excel can automatically generate percentage labels when creating a pie chart.
Can a pie chart contain decimal percentages?
Yes. Decimal percentages are common when exact values do not divide evenly.
Conclusion
Understanding how to calculate pie chart percentages helps you create accurate and meaningful visual representations of data. By using the correct pie chart percentage formula, converting percentages into degrees, and verifying your calculations, you can confidently build and analyze pie charts for school, business, or personal projects. Whether you’re working manually, using Excel, or creating charts in Google Sheets, mastering these calculations makes data easier to understand and communicate.
You Must Read About “Audiobook Calculator Percentage“